

Ever wondered if a subtle change in your computer’s performance might be hinting at a bigger issue? Think of a hardware monitor as that reliable friend who keeps an eye on your device’s health, checking temperatures, voltage, and fan speeds, all in real-time. It’s like having a fitness tracker for your PC, alerting you before a minor glitch turns into a serious problem.
With smart insights built to maximize performance, this tool helps ensure your computer runs smoothly and reliably. Next time you notice a slight dip in performance, you’ll know it’s just your system giving you a little heads-up, keeping potential issues at bay.
hardware monitor: Definition and Core Functions
A hardware monitor works like a friendly system health checker that keeps an eye on your computer's vital signs in real time. It looks into the heart of your PC by tracking key data such as temperatures, voltage levels, and fan speeds, kind of like a fitness tracker for your machine. Ever notice how even a small shift in temperature can hint at bigger issues? Well, a well-tuned monitor can catch those changes early so you don’t get caught off guard.
At its core, this tool continuously collects live metrics from various sensors in your computer. Using an intuitive interface, it shows you current readings along with the highest and lowest values recorded during your session. You can easily check important indicators like CPU and GPU temperatures, voltage fluctuations, fan speeds, and overall component usage. The clean, tree-like layout makes it simple to fish out details quickly, allowing you to spot anything that feels out of place.
When it comes to troubleshooting, hardware monitors make life a lot simpler. They let you export sensor data into a TXT file or copy it straight to your clipboard so you can share the information with tech support or review it later. Imagine noticing a steady climb in your CPU temperature; storing that log could be invaluable for diagnosing the problem. With straightforward export options combined with real-time data, these tools become essential not just for routine upkeep, but also for delving into deeper diagnostic tasks.
hardware monitor Features to Consider
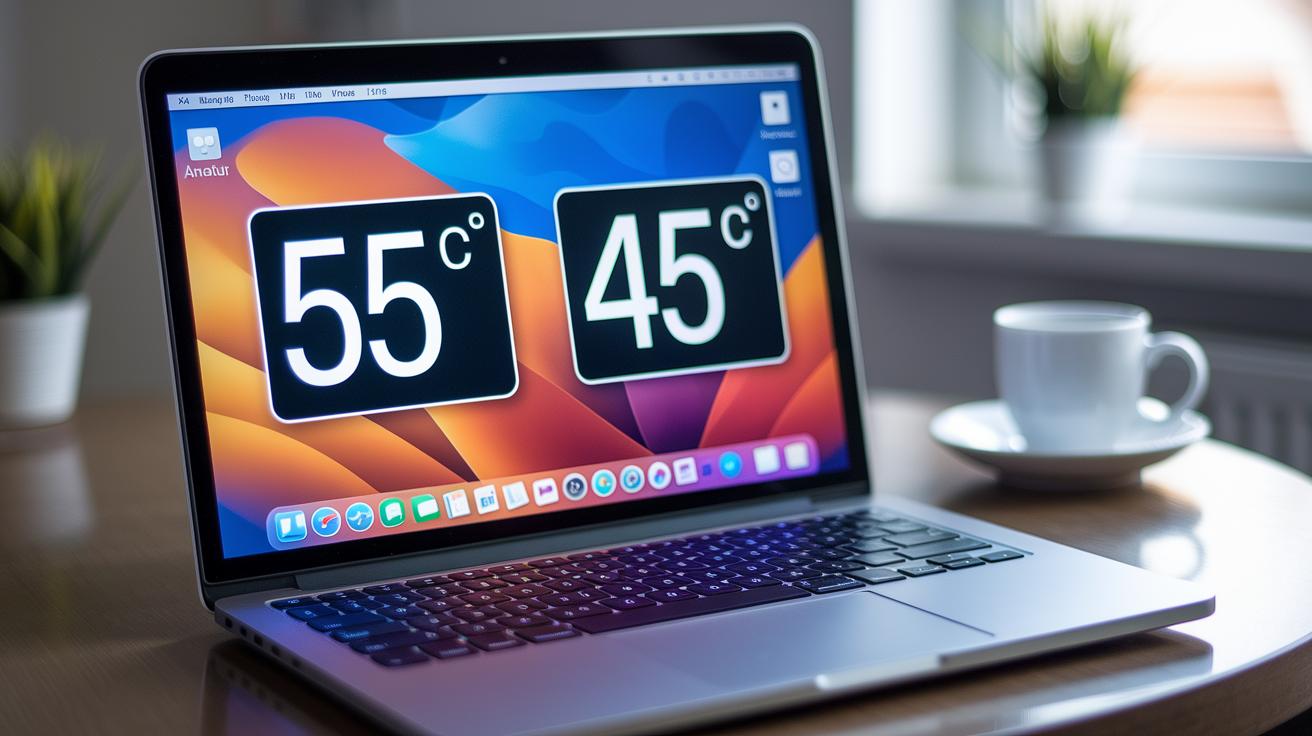
A robust hardware monitor delivers real-time sensor data, showing current, minimum, and maximum values all in one glance. This means you can track temperature, voltage, and fan speed trends as they happen, a handy feature for anyone who loves diving into system diagnostics. Imagine seeing a temperature sensor read "current: 55°C, min: 45°C, max: 70°C" right as you need it.
The program itself has a tiny footprint, about 2.86 MB, so it's fast to download and even easier to set up. It doesn’t auto-install drivers, but it thoughtfully provides links so you can update them manually, keeping your fan speed checker and power usage monitor perfectly aligned with your system’s demands.
Even if you’re working with an older computer, you’ll appreciate the software’s minimal learning curve and smooth performance. It uses smart scanning tools, like VirusTotal checks, to ensure the temperature sensor software is completely free of malware. Plus, its neatly organized interface lets you quickly spot any sensor readings that exceed safe limits, which is great when you want to set up alert thresholds.
When everything comes together, this hardware monitor becomes a reliable partner, helping you maintain peak performance for your computer.
hardware monitor: Smart insights for peak performance
Choosing the right utility to monitor your computer's health can feel like finding the perfect playlist, each option offers its own unique vibe. Imagine comparing five tools, each with its special way of showing sensor data and tracking performance. Whether you're all about real-time temperature updates or need a lightweight CPU tracker, the chart below lays out the key details in a friendly, clear format.
Each tool shines on its own, tailored to specific operating systems. For Windows enthusiasts, HWMonitor, SpeedFan, CPU-Z, and Core Temp provide a broad range of performance insights, from everyday checks to more detailed analyses. And if you're a Mac user, there’s a specialized option that taps directly into Apple's sensor chips to deliver thermal data. In short, this comparison helps you zero in on the hardware monitor that best meets your system's unique needs.
| Tool | Supported OS | File Size | Cost | Key Metrics |
|---|---|---|---|---|
| HWMonitor | Windows 2000+ | 2.86 MB | Free | Real-time temps, voltages, fan speeds |
| SpeedFan | Windows XP+ | Small | Free | Temperature readings and adjustable fan speeds |
| CPU-Z | Windows 7+ | Minimal | Free | CPU clocks and module specifications |
| Core Temp | Windows Vista+ | Compact | Free | Per-core CPU temperatures and loads |
| Hardware Monitor (Mac) | macOS Jaguar–Sierra | Lightweight | Free | Accesses Apple sensor chips for thermal data |
hardware monitor Installation and Configuration Guide
Windows Setup
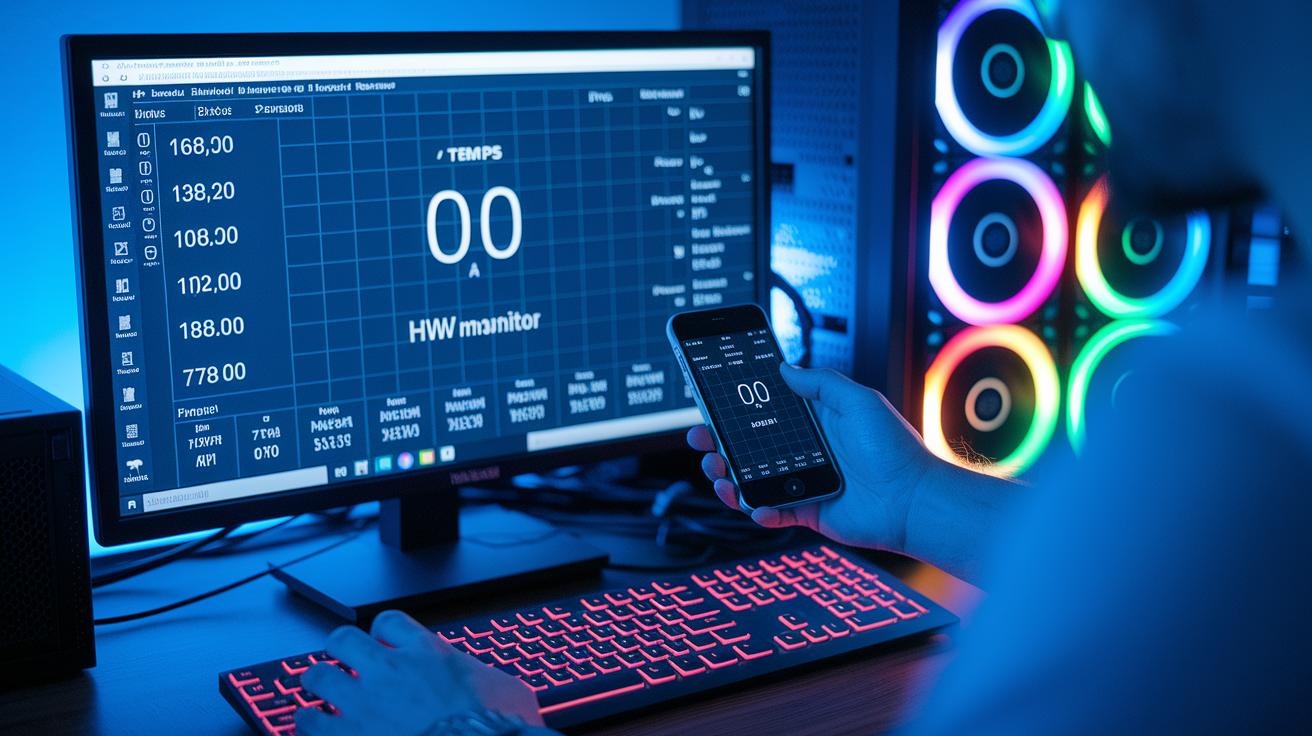
Begin by downloading the HWMonitor ZIP from its official source. Once you have the ZIP file, extract all its files into a folder you can easily access. Then, run the .exe file with administrative privileges so it can properly communicate with your hardware sensors. On your first launch, set the polling interval to decide how often the sensor data updates, for example, refreshing every few seconds gives you a near-real-time snapshot of your system’s performance.
Linux Setup
If you’re on Linux, the process starts with installing Mono, which supports .NET applications that many hardware monitoring tools use. After that, download the Open Hardware Monitor package and unzip it into your chosen directory. Open the application from your terminal, ensuring you have the right permissions. Once it’s running, customize the sensor modules to focus on the key system components you want to monitor, such as temperature or voltage levels. This step-by-step approach makes sure your diagnostic tool works seamlessly with your Linux setup.
macOS Setup
For macOS users, getting started is really simple. Download the Hardware Monitor app and then drag it into your Applications folder, following the system’s installation protocols. Make sure to grant the needed permissions so the app can access the sensor data. Finally, pick the supported sensors that match OS X versions 10.2 through 10.12 to ensure everything runs smoothly.
hardware monitor Troubleshooting Tips
When you're troubleshooting a hardware monitor, missing sensor readings, outdated drivers, and permission issues are some of the most common hurdles you might face. Sometimes you'll notice that a sensor simply isn't showing up in your diagnostics tool. It might be that your BIOS settings haven't enabled that sensor, or perhaps you need to update vendor-specific drivers.
Running the software without administrative privileges can also keep sensor data from being read, kind of like trying to open a locked file without the right key. So, first check that your computer's BIOS settings let sensor monitoring run freely. Remember, hardware monitoring tools don't install drivers automatically; you're in charge of updating them through your manufacturer's site.
Try running the application as an administrator to give it the access it needs. Updating your chipset drivers can fix many detection issues, so head over to your motherboard's support page for the latest updates. And if you're a Mac user, keep in mind that older OS versions might not display sensor readings as expected.
Taking these simple steps can help transform your hardware monitor into a more dependable source for checking your system's health.
hardware monitor Advanced Strategies for Power Users

For those who love to push their systems to the max, scheduling data exports can really change the game. Picture this: automatically exporting real-time logs to CSV, so you can feed sensor data into your go-to spreadsheet or automated script. This means you could set up a routine every few minutes to build a detailed performance timeline, making it much easier to spot patterns or unusual behavior.
By blending these log exports with your performance dashboard, you can easily match sensor readings with adjustments made during overclocking. It’s a smart, portable tactic that keeps you in touch with every aspect of your system’s performance over time.
And if you’re looking to take control even further, try using open-source APIs or a command-line interface for remote tracking. This approach lets you set custom sensor limits and alerts while monitoring your system over the network. With a fully customizable tracking tool, you can set specific temperature or voltage thresholds that trigger alerts, ensuring your system stays at its best even when you’re not around. Such strategies help turn raw sensor data into clear, actionable insights for top-notch performance.
Final Words
In the action, we walked through what a hardware monitor does – tracking temperatures, fan speeds, and voltage readings. We covered core functions, standout features, tool comparisons, setup instructions, and ways to troubleshoot common issues. The guide even shared smart tips for power users who want to export logs or set remote alerts. The hardware monitor stands as a simple yet effective tool to help you make informed tech decisions. Stay curious and enjoy putting these techniques to work.
FAQ
What is Open Hardware Monitor?
The Open Hardware Monitor is an open-source tool that tracks temperatures, voltages, and fan speeds, providing real-time sensor data to help you keep tabs on your system’s health.
How do I download Open Hardware Monitor?
The Open Hardware Monitor download process involves visiting its official page, downloading the compressed file, extracting it, and then running the executable to access your system sensor data.
What is CPUID hardware monitor?
The CPUID hardware monitor provides detailed system and CPU information, including sensor readings and performance metrics, giving you a clear and organized view of your device’s operational status.
What is Libre Hardware Monitor?
Libre Hardware Monitor is a free, open alternative that tracks key system metrics like temperature and voltage, offering a straightforward method to check your hardware’s performance.
Is there a hardware monitor for Windows 11?
Hardware Monitor for Windows 11 delivers comprehensive sensor tracking, displaying real-time temperatures, voltages, and fan speeds, and is designed to work seamlessly with Microsoft’s latest operating system.
Why might Open Hardware Monitor not show CPU temperature?
Open Hardware Monitor not showing CPU temperature suggests the sensor could be disabled or the drivers outdated; checking BIOS settings and updating drivers typically resolves this issue.
What is a CPU temp monitor?
A CPU temp monitor reads a processor’s temperature in real time, alerting you to potential overheating issues and helping you maintain optimal performance and system safety.
What is a hardware monitor?
A hardware monitor reads essential system metrics—like temperature, voltage, and fan speed—to provide insights into your computer’s component health and overall performance.
What does Hardware Monitor Pro do?
Hardware Monitor Pro delivers advanced sensor tracking with detailed performance graphs and alert configurations, helping experienced users manage and assess their system’s health efficiently.
Is HWMonitor safe to use?
HWMonitor is widely recognized as safe, having been consistently used to track system performance with confirmed clean scans and positive user feedback over many years.
How can I view my hardware information?
You can view your hardware information by using utilities like CPU-Z or HWMonitor, which read sensor data to display details about your CPU, GPU, storage, and other system components.
What does CPU-Z offer?
CPU-Z provides concise details about your system’s processor, clock speeds, and specifications, making it a dependable tool for quickly checking CPU and hardware information.
What does Hwinfo provide?
Hwinfo offers extensive system diagnostics by presenting detailed sensor data, including temperatures and performance metrics, assisting you in monitoring system stability and component health.
How does MSI Afterburner support system monitoring?
MSI Afterburner not only monitors GPU temperatures and performance but also includes overclocking features, offering a robust solution for gamers and enthusiasts looking to optimize graphics settings.
How does GPU-Z function?
GPU-Z specializes in monitoring video card information by displaying specifications and temperature readings, ensuring you have clear insights into your graphics processing unit’s performance.
What is System Information used for?
System Information is a built-in utility that provides comprehensive details on hardware components, drivers, and system configuration, making it useful for quick troubleshooting and system checks.
What does CrystalDiskInfo measure?
CrystalDiskInfo measures the health of your storage devices by tracking temperatures, error rates, and performance indicators, aiding you in maintaining reliable disk performance.