


Ever wondered if a small voltage dip could be signaling bigger trouble? HWMonitor brings your computer’s inner workings to life by tracking voltage, temperature, and fan speed in real time. Its clear, tree-style layout makes it a breeze for both newcomers and seasoned techies to catch early warning signs. More than just a log of data, this trusty tool helps ensure your computer runs smoothly. So, why not keep an eye on these live signals and give your system a performance boost?
Hardware Monitor: Power Up System Performance
HWMonitor is a handy tool that gives you real-time insights into your system all laid out in a clear, tree-style interface. It keeps track of vital details like voltage, temperature (with handy minimum and maximum readings), and fan speed. Plus, you can log your data by saving it as a TXT file or copying it to your clipboard, which makes troubleshooting straightforward.
This all-in-one utility is perfect for quickly assessing your system’s health. Ever wonder how a tiny voltage fluctuation might hint at future hardware issues? One technician once discovered that a small dip in CPU voltage could signal an upcoming problem. That simple, readable display lets both newcomers and tech experts spot potential issues before they become a headache.
Developed by CPUID, this free application is impressively lightweight at just 2.86 MB and works smoothly on Microsoft Windows, from Windows 2000 right up to Windows 11. While it automatically links to official PC driver sources, you’ll need to update drivers manually. Rest assured, thorough security scans have confirmed its safety by detecting no malware.
In short, HWMonitor streamlines your diagnostic process while empowering you to keep a close eye on your system’s performance, making it an indispensable ally for ensuring that your computer remains stable and reliable.
Installing Hardware Monitor on Windows and Linux
If you're setting up HWMonitor on your Windows machine, start by grabbing the HWMonitor v3.6 334 (2.86 MB) from CPUID’s website. This nifty tool is built for all versions of Microsoft Windows, from Windows 2000 right through to Windows 11. Installing it is straightforward; just run the installer and follow the prompts. One thing to note: HWMonitor doesn’t update drivers automatically. You’ll need to click the provided links in its interface to update drivers manually, a nice feature if you prefer to double-check compatibility yourself.
For Linux users, HWMonitor isn’t available. But don’t worry, you have alternatives. Consider tools like lm-sensors or the open hardware monitor, which offer similar monitoring for temperatures, fan speeds, and voltages. Just head to their websites, follow the download instructions, install, and soon you’ll be checking your system’s performance right after booting.
After installation on either system, it’s always a smart move to verify that your chosen tool is accurately tracking your hardware’s metrics. Double-checking compatibility and performance can help ensure everything runs smoothly.
Tracking CPU and GPU Temperatures with Hardware Monitor
HWMonitor provides real-time insights into your system's CPU and GPU temperatures in a clear and friendly manner. It displays precise minimum and maximum readings for each core, making it simple to monitor how each part of your processor is performing, even when you're not a tech whiz. Imagine it like checking a car's dashboard: you can keep track of everything at a glance.
Each sensor reading is presented in an easy-to-read format. GPU sensors, for instance, show current, minimum, and maximum temperatures, which is especially useful whether you’re gaming or crunching data on a workstation. Ever wonder how a subtle change in a sensor reading could be a lifesaver? One user shared how a slight dip in a CPU core's temperature preempted a critical system failure, saving hours of troubleshooting.
Logging and exporting these readings is incredibly simple. You can save your data to a TXT file or simply copy it to your clipboard for more detailed analysis later. This feature is like having a digital diary of your system’s behavior, helping you spot trends during intensive tasks or idle times, so you always know how your computer's cooling system is holding up.
- Review temperature trends regularly
- Log data during heavy workloads
- Compare min and max readings over time
By keeping a continuous watch on these detailed measurements, you get a clear picture of your system's cooling efficiency and overall stability. In short, HWMonitor helps you catch potential thermal issues well before they become a real problem.
Reviewing Voltage, Fan Speeds, and Power Metrics in Hardware Monitor
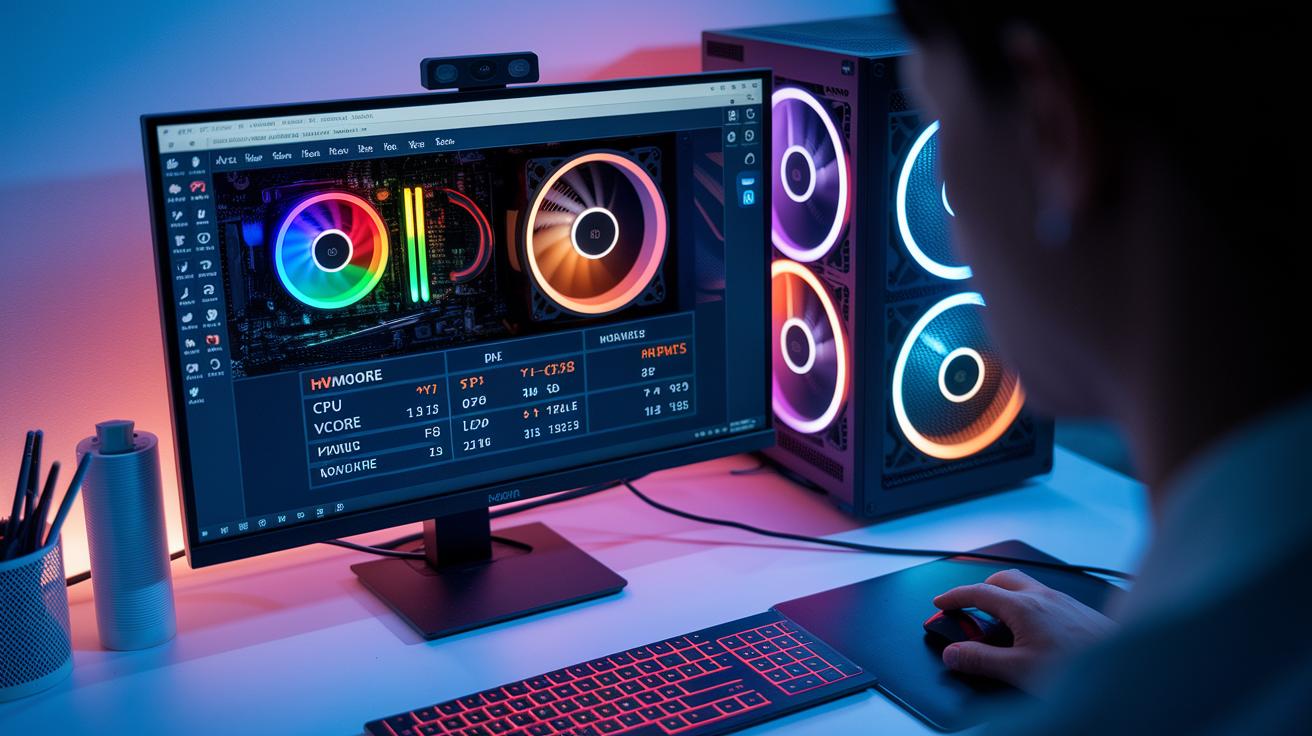
HWMonitor isn’t just about tracking temperatures. It also keeps an eye on key measurements such as system voltages, like CPU Vcore, and fan speeds. It monitors readings from components like the GPU +12V rails and logs their minimum and maximum values. This lets you spot trends and catch any power swings that might hint at hardware issues or cooling concerns.
The tool shows fan speeds in RPM, making it simple to check if a fan isn’t hitting its ideal pace. For instance, a big gap between min and max values could mean a fan is sometimes failing or that power levels are inconsistent. It works a lot like a resource usage analyzer, ensuring every component is performing the way it should.
- Check voltage readings to catch any unexpected dips or surges.
- Observe fan speeds to see if the cooling system maintains steady performance.
- Record min and max values to spot recurring differences that could signal underlying issues.
Keeping these metrics under review helps you detect early signs of power fluctuations and cooling problems, which in turn boosts your system’s stability and resilience.
Comparing Hardware Monitor with Alternative Utilities
HWMonitor impresses with its clean, no-nonsense interface that makes checking system stats a breeze. It offers real-time readings for temperatures, voltages, and fan speeds, but keep in mind it doesn't automatically install drivers or provide advanced fan controls. For instance, SpeedFan not only monitors these metrics but also gives you extra options to adjust your fan speeds. Some users even found that a simple tweak in SpeedFan’s fan control boosted their cooling during heavy processing loads.
CPU-Z, in contrast, goes deep into your processor’s details, presenting specs that HWMonitor leaves at a more surface level. Then there’s Core Temp, which zeroes in solely on CPU temperatures, delivering precise core heat readings. Every utility has its own strengths, so you can pick the one that fits your needs, whether you're after quick stats or in-depth analysis.
If you're into tweaking your motherboard too, proprietary options like Gigabyte Control Center come with specialized features. Although all these tools are available for free, some offer paid pro editions loaded with extras like logging, customizable alerts, and advanced diagnostics. These upgrades can be a smart choice if you’re after more detailed insights and improved usability.
| Utility | Interface Clarity | Key Features | Optional Upgrades |
|---|---|---|---|
| HWMonitor | Straightforward | Real-time metrics, manual driver updates | Basic only |
| SpeedFan | Detailed | Advanced fan control, extensive monitoring | Free |
| CPU-Z/Core Temp | Technical | Deep CPU specs; focus on temperature readings | Free |
| Gigabyte Control Center | Manufacturer-specific | Motherboard features, extra utilities | Paid pro edition available |
When making a choice, consider how easy each tool is to use along with extra features like customizable controls and detailed specs. And if you’re open to spending a bit for added functionality, the optional upgrades might be just what you need for a more tailored monitoring experience.
Customizing Alerts and Data Logging in Hardware Monitor
HWMonitor makes it easy to export sensor data manually into a TXT file, so you’re in full control of what gets recorded. Think of it like arranging your favorite ingredients for a recipe , you get to decide the order and grouping of the metrics to suit your workflow. You can even change the labels and arrangement to boost clarity, much like sorting files into neat, organized folders.
The tool doesn’t come with built-in alarms for temperature or voltage thresholds, but that’s where third-party wrappers step in when you need a heads-up. For example, you can configure a wrapper to send you an alert if the CPU temperature rises beyond a set limit, picture it notifying you immediately if one core tops 80°C.
If you prefer an automated routine, the pro-edit version and handy scripts can whip up detailed reports without any manual effort. These automated generators neatly compile historical log data and let you analyze past trends on the fly.
- Set up manual TXT exports to preserve historical data
- Use third-party wrappers for customizable threshold alerts
- Deploy scripts to create automated, detailed reports
These tweaks turn HWMonitor into a flexible tool that adapts its output to your unique monitoring needs.
Troubleshooting Common Hardware Monitor Issues and Best Practices
When HWMonitor doesn't recognize a sensor, it usually means your system's current drivers don't support it. A great first step is to update your drivers using the links provided in the program. And if you notice any missing or off readings, try reinstalling the software as an administrator to see if that fixes things.
It's also a smart idea to run a quick malware scan on the installer with your antivirus software. This extra check gives you the confidence that you're working with a clean, virus-free file.
Community forums can be a gold mine for tips, too. Many users share solutions for common UI glitches and sensor patch updates that worked well for them. By sticking to best practices during setup and performing regular system checks, you'll keep HWMonitor running as a reliable tool to monitor your system's health.
- Reinstall as an administrator if sensor readings are missing.
- Update drivers for any unsupported sensors.
- Scan the installer with your antivirus software for extra security.
Regularly checking sensor data along with a few resource optimization tips can keep your hardware monitor in top shape, always catching early signs of performance issues well before they become a problem.
Final Words
In the action, hardware monitor shows how reliable metrics can keep your system in check. The article walked through installing the tool on Windows and Linux, checking temperatures, voltages, fan speeds, and setting up alerts and logs. It also compared the tool with similar utilities and offered easy troubleshooting steps for common issues. This clear, step-by-step guide helps simplify system performance readings while encouraging practical, positive tech decisions. Enjoy exploring the capabilities of hardware monitor and feel confident about keeping your tech running smoothly.
FAQ
What is a hardware monitor?
The hardware monitor tracks system elements like temperature, voltage, and fan speeds in real time, providing clear insight into overall system health and performance metrics.
What does Hardware Monitor Pro do?
The Hardware Monitor Pro upgrades basic tracking by offering enhanced data logging, automated alerts, and in-depth analysis to help users keep a detailed watch on system performance.
Is HWMonitor safe to use?
The HWMonitor software is regarded as safe, with official downloads that are virus-free and clean security scans, making it a trusted tool for monitoring system hardware.
How can I see my hardware information using a monitor tool?
Using tools like HWMonitor or CPU-Z, you can view detailed hardware data including temperatures, voltages, and fan speeds, allowing a comprehensive snapshot of your system’s performance.
How do I download and install hardware monitor software on Windows?
Download the installer from the official website and run the small executable on your compatible Windows version; then manually update drivers as needed to maintain accurate sensor readings.
Can a hardware monitor be used on a Mac?
While HWMonitor is designed for Windows, Mac users can explore similar diagnostic tools that provide real-time hardware insights, ensuring monitoring capabilities across different operating systems.
What are some alternative hardware monitoring utilities?
Alternatives such as CPU-Z, Speccy, AIDA64, and Hwinfo offer varied features—from detailed CPU data to comprehensive diagnostics—providing users options based on their specific system monitoring needs.