


Ever wonder why your powerful computer sometimes drags its feet? CPUID Hardware Monitor acts like your personal system coach, keeping an eye on temperatures, fan speeds, voltages, and more, all updated in real time.
Getting started is a breeze. A simple double-click opens its clean, tree-structured display, showing you exactly what your computer needs for a healthy, steady performance. It transforms those complicated numbers into a straightforward check-up, helping you understand your machine's inner workings effortlessly.
Stick with us to see how this lightweight tool brings a sense of calm to your system’s daily hustle.
cpuid hardware monitor drives smooth system performance
CPUID HWMonitor is a lightweight tool that gives you real-time insights into your computer’s hardware. It monitors CPU temperature, voltages, fan speed (and PWM), power, clock speed, utilization, and bandwidth, all through a neat, tree-structured interface designed for Windows 10. Just double-click the downloaded executable, and the tool launches right away, making setup a breeze.
The installation is incredibly simple. You download an executable file from the official website and launch it with a double-click. During setup, you get a choice between the free version and the Pro edition. The Pro version even lets you monitor your system remotely using connections from multiple devices. This is perfect if you ever need to keep tabs on several workstations, perhaps even from an Android device.
CPUID HWMonitor works on various versions of Windows, including Windows 7, 8, and 10 in both 32-bit and 64-bit. It has a small disk footprint, and its development dates back to September 2009. The current version, 1.46, was released on September 14, 2021, which shows their ongoing commitment to improvements. For more detailed technical info or to try it out, check the hardware monitor link.
At its core, this tool not only provides essential diagnostic data but also makes system management straightforward, helping ensure your system runs smoothly every time you check.
Step-by-Step Installation and Setup of CPUID Hardware Monitor

Before starting, make sure your computer meets the needed requirements. The CPUID Hardware Monitor works on Windows 7, 8, and 10 (both 32- and 64-bit) and needs at least 20 MB of free space on your disk. After installation, you can easily tweak advanced settings like how often the screen refreshes.
First, head over to the official website and download the executable file. Double-click the .exe file to launch the setup. If nothing happens, try right-clicking the file and choosing Run as Administrator or use compatibility mode.
During the setup process, you’ll be asked to choose between the free version and the Pro version. If you go with the Pro version, you'll need to enter a valid serial number to activate it, something like "1234-5678-ABCD-EFGH" when prompted.
Once the installation is complete, open the settings panel to further customize your experience. You can adjust sensor update intervals or enable detailed logs to get the performance just right. For example, if your system is under heavy load, lowering the refresh interval could help reduce CPU usage.
| Issue | Resolution |
|---|---|
| Installer does not launch | Right-click and select Run as Administrator |
| Activation error with Pro version | Double-check the serial number and your internet connection |
Navigating the CPUID Hardware Monitor Interface and Configuration
Main Dashboard Overview
When you open HWMonitor, you’re greeted by a neat tree view that shows your sensor readings in real time. Think of it as an organized map of your system’s hardware where sections like CPU, GPU, and the motherboard are neatly arranged into expandable branches. Each branch reveals details like the temperature of individual CPU cores and overall package temperatures. It’s designed for quick access, just click to expand or collapse sections and instantly spot, for example, which CPU core gets the hottest under load. This setup makes it easy to focus on the most important performance indicators without wading through unnecessary data.
Setting Up Custom Alerts and Graphs
Customizing the display in HWMonitor is straightforward. With just a few clicks, you can fine-tune the interface to show only the sensors you care about. Want a heads-up when something’s amiss? You can set threshold alerts so you’re notified if a sensor reading climbs to a level that might impact your system. Plus, turning on the graphical logging tool gives you line charts that track sensor readings over time, making it easier to spot trends and keep your system safely within its limits. And if you need a different view, you can effortlessly switch between a full-screen setup and a compact window.
- Sensor tree panel
- Graphical log viewer
- System tray icon settings
- Menu bar actions (File, Options)
- Pro-only remote connection panel
This intuitive setup ensures that whether you’re monitoring individual core temperatures or checking on overall system health, every tool is right at your fingertips. The blend of clear visuals and simple controls makes keeping an eye on your hardware both practical and effective.
Monitoring System Performance with CPUID Hardware Monitor Sensors and Data Interpretation
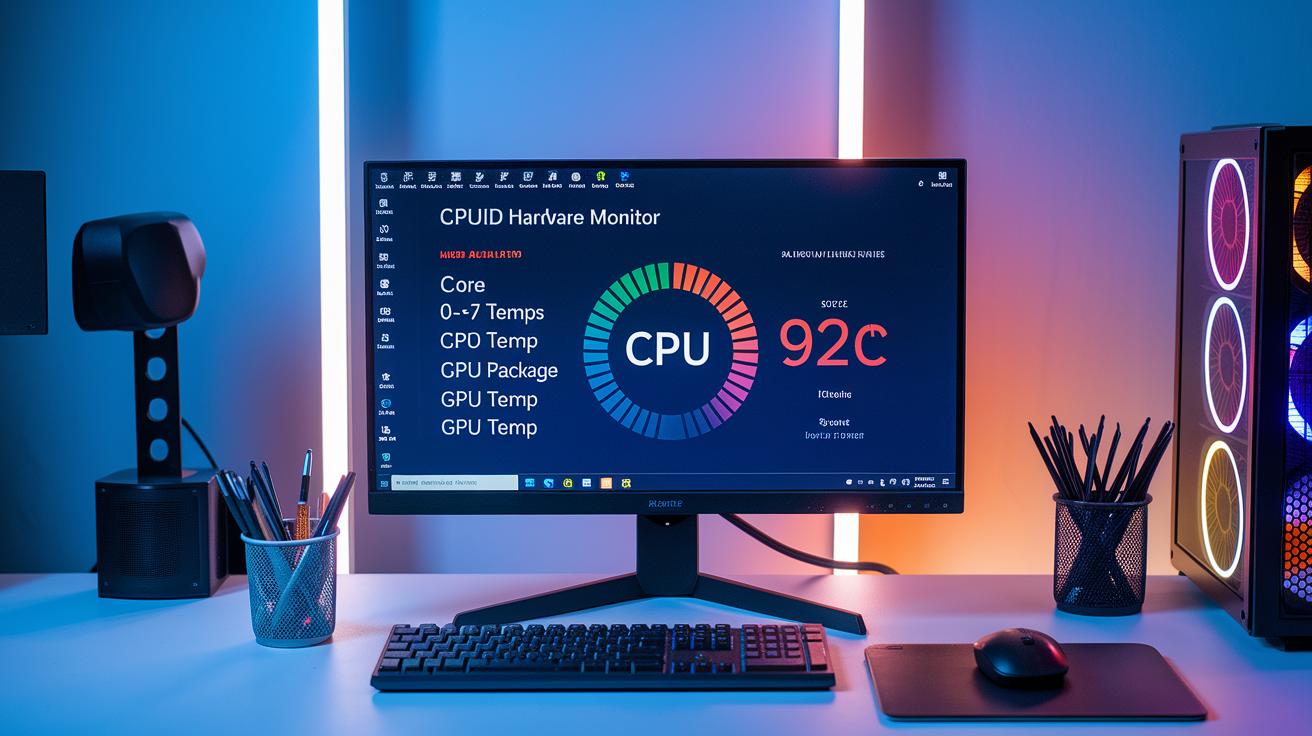
CPUID Hardware Monitor gives you a straightforward look at your system’s key stats. It breaks down information like the temperatures for each core (Core 0 through Core N) and even the overall CPU package temperature. Keeping an eye on these numbers is really important, if the hottest core goes above 90 to 95 °C when you’re under load, it’s a good idea to check your cooling. Ever notice one core spiking to 92 °C while the others remain cool? That’s your cue to inspect your cooling system, no doubt.
It also tracks your GPU temperature using onboard sensors. While there might be a few minor differences compared to other tools, it still paints a reliable picture of your GPU’s well-being. The software even monitors voltage from both the PCIe slot and auxiliary connectors, which helps you make sure your components are getting steady power. A sudden voltage drop or spike might be a sign to review your power supply’s performance. Plus, TMPIN sensors – which measure temperatures in areas like VRMs or chipset zones – provide extra context. It’s always smart to check your motherboard manual for details on these sensors.
The program also keeps an eye on fan speeds by reading the RPM for each fan. This lets you see at a glance if your cooling is keeping up with your system’s demand. If you notice fans suddenly slowing down, it might be time for a quick clean or even a replacement.
For a handy visual summary, here’s the sensor data table:
| Sensor Type | Measured Value | Interpretation Tip |
|---|---|---|
| Core Temps | 45–95 °C | Keep an eye on the highest core under load |
| CPU Package | 40–90 °C | Main thermal metric to watch |
| Voltage Rails | 1.0–12 V | Ensure stability during stress tests |
| Fan Speed | 500–4000 RPM | RPM should match the system’s load |
The tool also offers data logging so you can export these readings for later review. This helps you spot trends over time and confirms that your system is running safely and efficiently.
Advanced CPUID Hardware Monitor Features: Remote Monitoring, Logging, and Pro Tools
HWMonitor Pro really elevates system diagnostics by letting you keep tabs on multiple devices from anywhere. With a one-year plan, you can monitor up to 10 devices, and with a two-year plan, that jumps to 20. It’s like having the ability to check your system’s heartbeat whether you're at your desk or on the move with your Android phone. Imagine casually glancing at your gaming PC’s core temperature during a power surge, all from your smartphone.
The software also packs a nifty logging tool that captures sensor data in CSV format. This means you can export your data for in-depth diagnostics or to track performance over time, making it simple to spot changes or run benchmarks. Plus, the customizable interface lets you focus only on the metrics you truly care about.
Forum chatter reveals that these Pro-only features often make troubleshooting a lot simpler, thanks to clear, remote access diagnostics. And with frequent updates since 2009, HWMonitor Pro not only remains a powerful diagnostic tool but also a trusted partner in keeping your systems running smoothly.
Troubleshooting CPUID Hardware Monitor: License, Updates, and Common Issues

When activating the Pro version, a serial key mismatch might pop up if there’s a typing error. Just take a moment to re-enter the key, making sure each character is spot on. And if the error sticks around, reaching out to support is a good next step.
Updating can sometimes be a bit of a hassle. If you run into an update error, try downloading the latest installer manually. By doing this, you can sidestep any unexpected in-app hiccups. Trial users have enjoyed the straightforward interface, but many have mentioned they’d appreciate a few more in-app update prompts to guide them through any issues.
Here are a few straightforward steps to help troubleshoot common problems:
- Double-check your serial key during Pro activation to ensure no typos.
- Manually download and run the latest installer to fix update errors.
- Follow the in-app instructions if you’re on a trial version.
- Restart the application after each troubleshooting step to see if the issue clears.
- If the problem persists, a quick support inquiry can often do the trick.
These simple fixes can keep your tool running smoothly, ensuring your system checks stay uninterrupted.
CPUID Hardware Monitor vs. Open Hardware Monitor: Benchmark and Comparison
CPUID HWMonitor distinguishes itself with a remarkably user-friendly interface that's easy to navigate, scoring around 90% in usability and 85% for its features. It’s an excellent pick when you compare it with the free, open-source Open Hardware Monitor. While both offer similar sensor readings, HWMonitor really shines with its remote monitoring capabilities and a gentler learning curve. Sure, Open Hardware Monitor has the advantage of being fee-free, but its interface might require a bit of a learning period. And if you're looking for deep diagnostic insights, HWiNFO64 goes further, but for everyday performance tracking, HWMonitor strikes a smart balance between simplicity and power.
Benchmarks back up its efficiency, showing that HWMonitor uses less than 5 MB of RAM compared to the 7 MB that Open Hardware Monitor tends to consume. This lean memory footprint is a real bonus for systems where every megabyte counts, ensuring smoother overall performance. Plus, HWMonitor offers advanced logging and customizable sensor displays, which help you keep an eye on your system’s health over time. The clear visuals and straightforward controls make it a reliable partner for regular system maintenance and troubleshooting.
- Lower memory footprint ensures better performance
- Intuitive sensor visuals enable quick and effective diagnostics
- Remote monitoring adds convenience for managing multiple devices
All in all, CPUID HWMonitor stands out as a strong choice for anyone seeking a blend of ease-of-use and robust performance analytics.
Final Words
In the action, our article showcased the cpuid hardware monitor’s key features: from a hassle-free download and installation process to a detailed walkthrough of its interface, sensor readings, and advanced logging tools. We also touched on remote monitoring tips, troubleshooting steps, and a benchmark comparison with similar tools. This guide gives you everything needed for smooth system performance and smarter tech choices. Enjoy a renewed sense of control over your system monitoring and tech management.
FAQ
What does CPUID Hardware Monitor track?
CPUID Hardware Monitor tracks real-time sensor data such as CPU temperature, voltages, fan speed, clock speed, and bandwidth, providing essential system information for both casual users and tech experts.
How do I download and install HWMonitor?
The HWMonitor download is straightforward—a simple executable file that you double-click to install on Windows, with clear prompts to choose between the free and Pro editions.
Is HWMonitor from CPUID safe to use?
HWMonitor is considered safe as it comes from CPUID, which has maintained active development and trusted performance since its initial release in 2009.
What is a CPUID hardware monitor in my computer?
A CPUID hardware monitor is a tool that reads sensor data from your computer, including temperatures and voltages, to help you keep an eye on system performance and stability.
How does CPUID Hardware Monitor compare to Open Hardware Monitor and similar tools like CPU-Z or GPU-Z?
CPUID Hardware Monitor offers a comprehensive overview with Pro features like remote monitoring and logging, while alternatives such as Open Hardware Monitor, CPU-Z, or GPU-Z target specific sensor readings or diagnostics with different interfaces.
Can I remove CPUID from HWMonitor?
CPUID is an integral component of HWMonitor and isn’t designed to be removed independently; uninstalling the entire application is the only way to eliminate it.